Good Morning, It’s Wednesday, April 9.
Topic: Tariff-driven pricing strategy | Demand elasticity | Price modeling
For: Operators. Pricing Managers. Business Leaders
Subject: Economics → Practical Application
Concept: Price elasticity modeling in tariff environments
Application: Using elasticity data to make critical pricing decisions during economic shocks
Don’t keep us a secret. Share this newsletter with friends (copy URL here).
What is going on
New U.S. tariffs in 2025 (25% on imported vehicles, 10% baseline on most imports) have disrupted the market.
Automakers are responding with strategic pricing moves, offering a real-time case study in navigating economic shocks.
Let’s break down what Ford, Ferrari, and others are doing—and how you can use their logic to price your product, today.
Real-World Snapshot
Ford rolled out “employee pricing for all,” giving regular customers insider discounts to clear inventory.
Nissan cut MSRPs by up to $1,900 on models like the Rogue and Pathfinder, targeting elastic buyers.
Stellantis launched deep dealer incentives under its “Freedom of Choice” campaign to maximize volume.
Ferrari raised prices by 10% on most models but absorbed costs on high-end models to protect loyalty.
Toyota and Hyundai froze prices temporarily, buying time and trust.
BMW will cover tariff costs until May, with planned price increases later.
Different strategies, same shock: a 25% tariff on imported vehicles and parts.
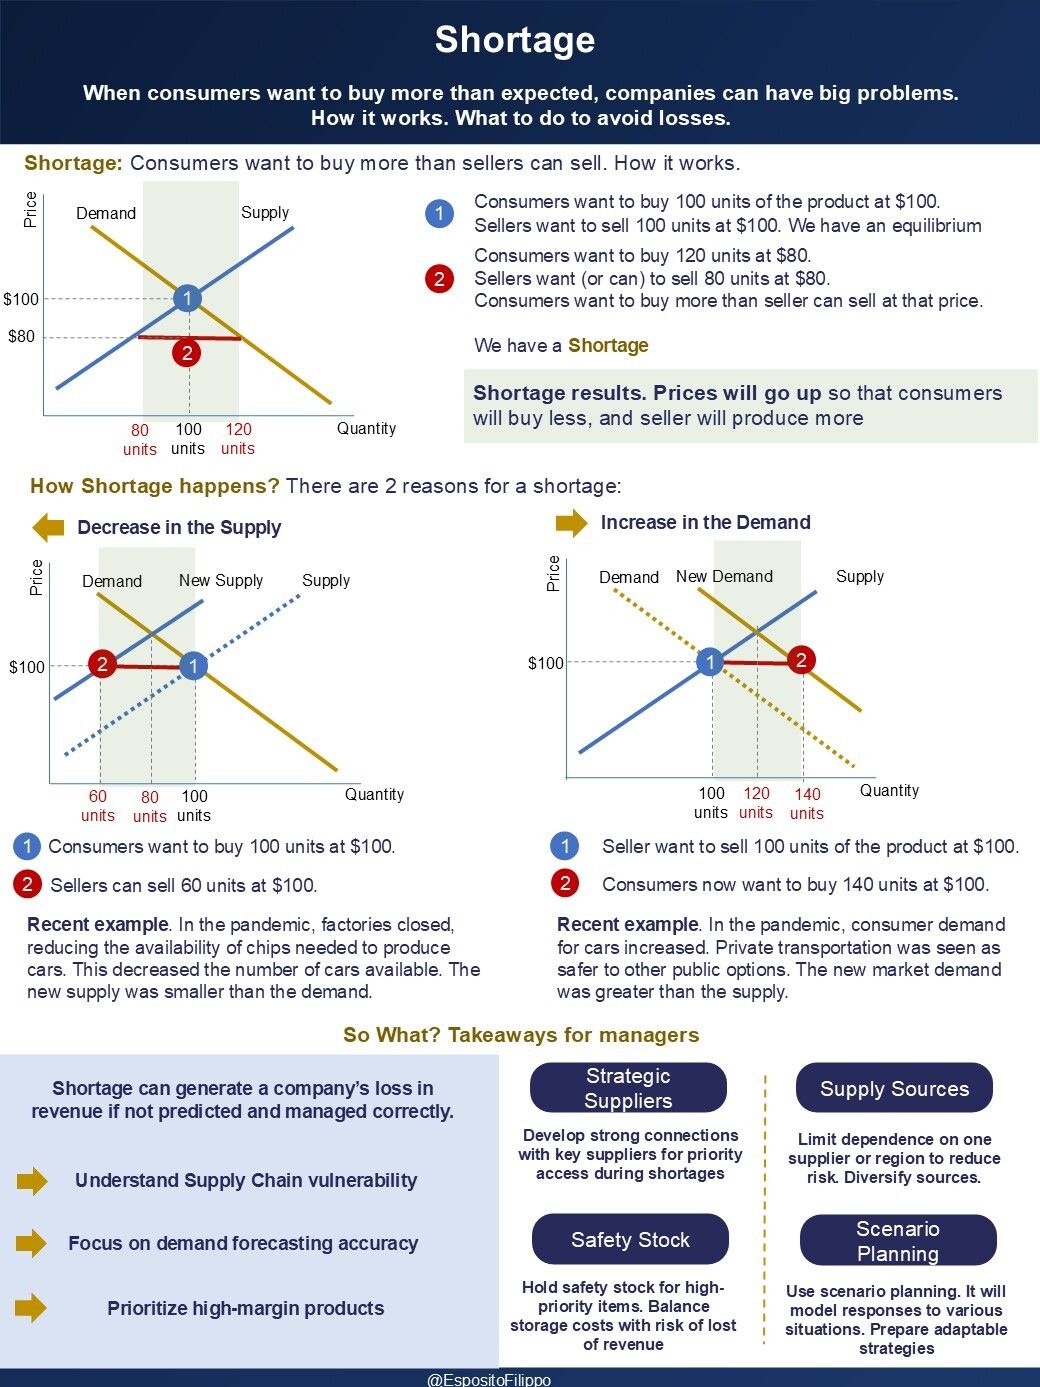
The Bigger Picture: Tariffs Create Surpluses and Shortages
Tariffs disrupt supply-demand equilibrium:
Costs Rise: Importers face higher costs for vehicles, parts, or products not made domestically.
Reactions Vary: Some pass costs on (Ferrari), others absorb them (BMW), some discount (Ford), others freeze (Toyota).
Demand Shifts: These moves change buying behavior, triggering:
Shortages: If promotions work too well (e.g., Ford’s discounts spike demand, supply can’t keep up).
Surpluses: If demand fades post-discount (e.g., unsold inventory piles up after Nissan’s price cuts).
This echoes 2021: artificial demand, production whiplash, inventory mismatches.
Supply decrease (S1 to S2) → higher prices (P1 to P2), lower quantity (Q1 to Q2).

Demand decrease (D1 to D2) → lower prices (P1 to P2), unsold inventory.

Why Demand Elasticity is the Missing Variable
Elasticity measures how much demand changes when the price changes:
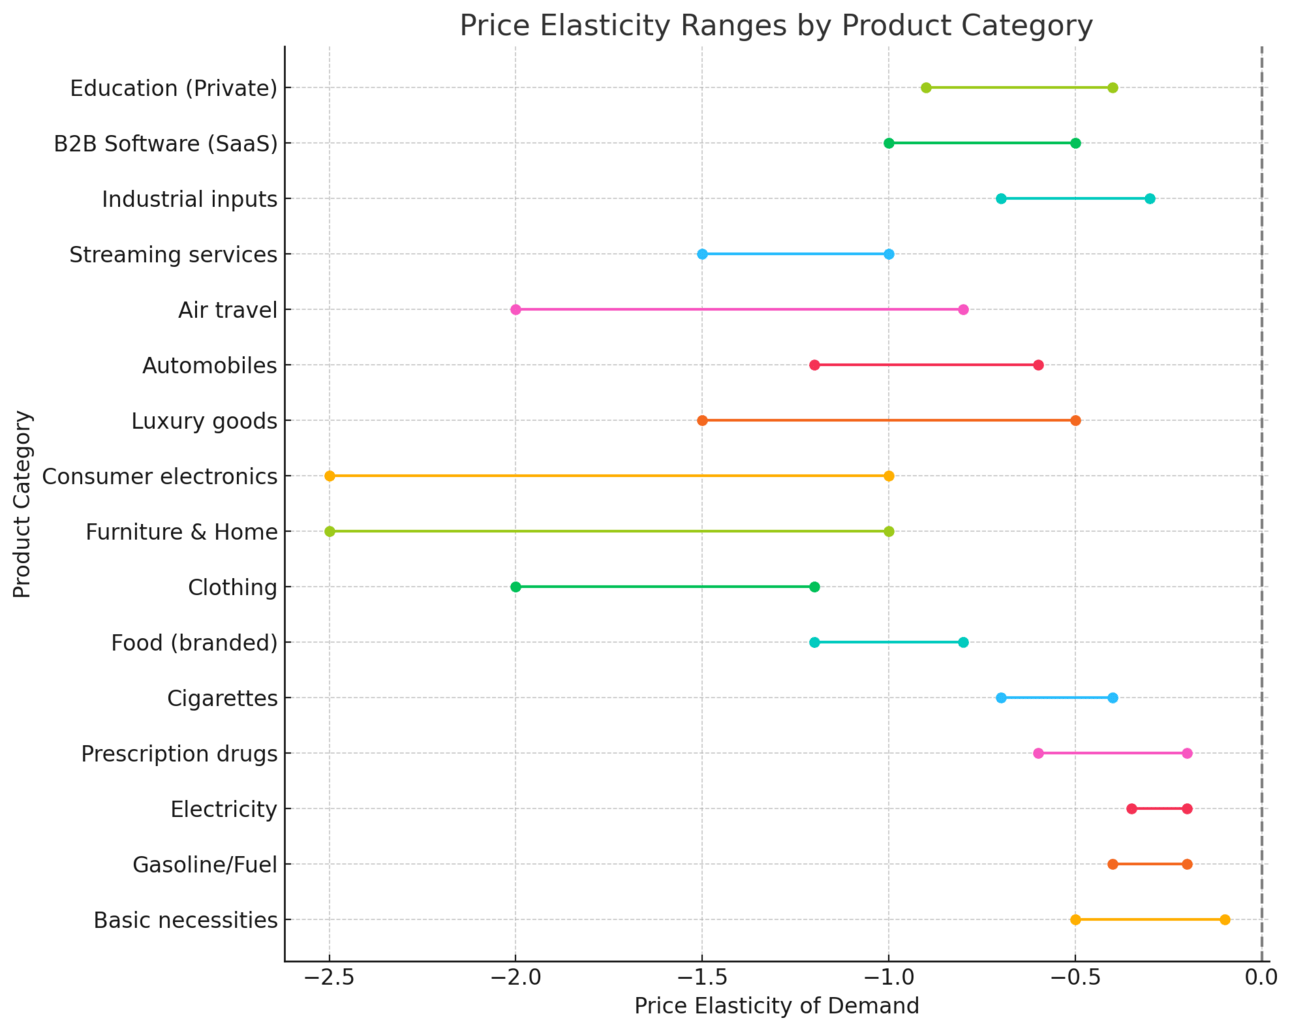
High Elasticity: Small price hike = big sales drop (e.g., mass-market autos, elasticity ~–1.2).
Low Elasticity: Price goes up, buyers still pay (e.g., luxury goods, elasticity ~–0.5 to –1.0).
Automakers are betting on this: Ford pulls forward elastic demand with discounts; Ferrari knows its buyers are inelastic—they’ll pay.
Here’s a benchmark of elasticity ranges across industries:

Data from McKinsey, 2024
How to Estimate Elasticity Today (With or Without Data)
You don’t need a PhD or a survey. Here’s how:
Option A: You Have Past Sales Data
Use Excel for linear regression:
Quantity Sold = a + b × Price
Get slope and intercept using Excel’s =LINEST()
Forecast: Q = Intercept + (Slope × Price)
(For a comprehensive use of linear regression and statistics for better sales forecasting and demand, read here).
Option B: You Have No Data
Use the elasticity chart above, then plug into this formula:
New Q = Current Q × (1 + Elasticity × %∆Price)
Example: 1,000 units at $100, 10% price increase to $110, elasticity –1.2:
New Q = 1,000 × (1 – 1.2 × 0.10) = 880 units
How to Test Price Sensitivity Without Talking to Customers
No time for surveys? Use these signals:
Compare volume before/after past price changes
Track cart abandonment or quote drop-off
Ask your sales team where objections hit
Study competitors who raised prices—did they lose share?
Cost-Plus vs. Value-Based Pricing (and When to Use)
Choose your pricing model intentionally:
Cost-Plus Pricing: Price = Cost + Margin
Good for stable costs, commoditized products. Risky with tariffs (costs rise unpredictably).Value-Based Pricing: Price = What customers believe it’s worth
Good for differentiated offers, strong brands (e.g., Toyota’s price freeze signals reliability).
Hybrid Approach: Use cost as your floor, value as your ceiling.
Tactical Pricing: What to Do Now
Let’s get concrete with a 4-step playbook:
Step 1: Define Your Pricing Objective
What’s your goal?
Maximize volume (Ford)?
Protect margins (Ferrari)?
Survive tariffs (BMW)?
Defend market share (Toyota)?
Every number follows this intent.
Step 2: Build 3 Pricing Scenarios
In Excel:

Step 3: Build Your Price Ladder
Add more price points ($95, $105, $115, $120, $125). Estimate demand and profit:

Revenue-maximizing price ($90: $100,800)
Profit-maximizing price ($95: $30.7K)
Risk-minimizing price ($100: stable demand)
Step 4: Implement and Monitor
Update pricing in POS/ERP systems.
Notify distributors and train sales teams on new pricing.
Monitor sales daily for 2 weeks, adjust if demand deviates (e.g., use flash sales for surplus inventory).
What Are Automakers Actually Doing?
They’re running this playbook with different elasticity assumptions:
Mass-Market Brands (Ford, Nissan, Stellantis): Elastic customers → discount now → defend volume.
Luxury Brands (Ferrari, BMW): Inelastic buyers → pass on costs or absorb temporarily.
Toyota, Hyundai: Freeze prices → signal stability → buy time.
What to Expect in the Coming Months
Initial “Buy Now” Rush: Promotional period (through June) will spike sales.
Price Adjustment Phase: June-July, expect 5-10% price increases.
Demand Cliff: Sales will drop as elasticity effects kick in.
Inventory Imbalance: Popular models may become scarce; less desirable ones create surpluses.
Production Shift: Manufacturing will relocate to avoid tariffs (12-18 months).
Action Tip: If sales drop in July, reduce production by 10% to avoid surplus.
Limitations
Data Accuracy: Historical data may be outdated during rapid shocks (e.g., JPMorgan predicts a 40% global recession probability in 2025).
Market Variability: Elasticity varies by region and segment (e.g., California luxury buyers may be less price-sensitive than Texas).
External Factors: Competitor pricing or consumer income shifts can skew results (e.g., if Harley-Davidson discounts, your elasticity may increase).
Short-Term vs. Long-Term: A 10% price increase might initially reduce demand by 12% (elasticity –1.2), but over months, customers may switch to substitutes, increasing elasticity.
Complement elasticity with real-time feedback and scenario testing.
Where Can You Apply This?
Consumer Electronics: Model elasticity by price tier (e.g., iPhones –0.8, budget phones –1.5).
Retail: Use price laddering to maintain value while adjusting costs.
Manufacturing: Build scenarios to guide production decisions.
Software/Services: Leverage lower elasticity of existing customers vs. new ones.
The Playbook You Can Use
Your short-form checklist:
Estimate elasticity (regression or benchmarks)
Set your objective (volume, margin, defense)
Build price scenarios (with Excel, not guesses)
Create a price ladder (pick the best outcome)
Implement, monitor, and adjust (watch signals, act fast)
Top Links to Deep Dive
Want to go beyond today’s breakdown? Here are the best resources to master this topic:
Harvard Business Review – A Refresher on Price Elasticity. Link here.
Educba – Price Elasticity Formula. Excel tutorial
Khan Academy – Elasticity. Video here.
Forbes – Understanding Pricing Strategies, Price Points And Maximizing Revenue. Link here.
Economics – Effect of tariffs. Link here.
The Noble Manager – Sales Forecasting Simplified: A 3-Step Framework for Better Decisions. Link here.
BBC – What are tariffs and why is Trump using them? Link here.