Good Morning, Noble Managers! It’s Wednesday, August 20.
Topic: Financial Strategy | Capital Investment | Trade Adaptation
For: B2B and B2C Managers.
Subject: Capital Budgeting (part 2) → Practical Application
Concept: Evaluate local production with capital budgeting
Application: Use Payback Period and Discounted Payback to assess recovery time
Don’t keep us a secret. Share this newsletter with friends (copy URL here).
TL;DR:
Why escalating tariffs and big company deals push firms to prioritize cash recovery
How Payback Period and Discounted Payback guide local production timing
2025 outlook: Master these tools as tariffs may hit 30%—act now to thrive
Introduction
Since our last newsletter on August 13, 2025, the trade landscape has evolved. The Bloomberg post on X reveals the U.S. government’s deepening ties with giants like Tesla and Intel, offering tax breaks and subsidies for U.S. production, following Nvidia’s 15% revenue deal and Apple’s $600 billion investment.
For medium and small U.S. importers, tariffs are no longer just a threat—they’re a new reality.
Capital budgeting is your hedge, growing more critical by the day.
Last week, we mastered NPV ($13,722 at 10%) and IRR (12.5% vs. 10%).
Now, Part 2 focuses on Payback Period and Discounted Payback for cash recovery, with Part 3 on profitability ahead.
Understanding Payback Periods: Your Cash Flow Compass
The Payback Period and Discounted Payback Period are your cash flow compass, measuring how quickly an investment—like a local production facility—recovers its initial cost.
Unlike NPV and IRR, which focus on long-term value and returns, Payback methods prioritize short-term recovery—use Payback for quick liquidity checks (e.g., under 5 years) and Discounted Payback when time value matters, often alongside NPV/IRR for a complete picture.
The techniques include:
Payback Period: Simple time to recover investment without discounting.
Discounted Payback Period: Adjusts for time value, aligning with NPV’s approach.
(Next: Profitability Index and Equivalent Annual Cost in Part 3.)
Value Proposition:
These metrics help you avoid cash crunches, ensuring you can reinvest or weather tariff shocks, making them vital for mid-sized firms with limited buffers compared to big players’ government deals.
Payback Period and Discount Payback 101
Payback Period:
This method calculates the time required to recover the initial investment through cash inflows, ignoring the time value of money.

How to Apply:
Determine the initial investment and estimate annual cash inflows.
Divide the initial investment by the annual cash inflow (for even cash flows) or cumulatively add cash flows until the investment is recovered (for uneven cash flows).
Compare the payback period to a predetermined acceptable period.
Accept if the payback period is less than the target; otherwise, reject.
Discounted Payback Period:
Similar to the payback period but accounts for the time value of money by discounting cash flows.
Formula: Cumulatively sum the discounted cash flows until the initial investment is recovered.
How to Apply:
Discount each cash flow
Add the discounted cash flows period by period until the sum equals or exceeds the initial investment.
Calculate the fractional period if necessary.
Accept if the discounted payback period is within the target timeframe.
Example:

Payback Example: A $20M investment with $7M annual cash flow recovers in 2.86 years—quick and liquid!
Discounted Payback Example: Same $20M with $7M/year discounted at 10% takes 3.5 years, reflecting true cost of capital.
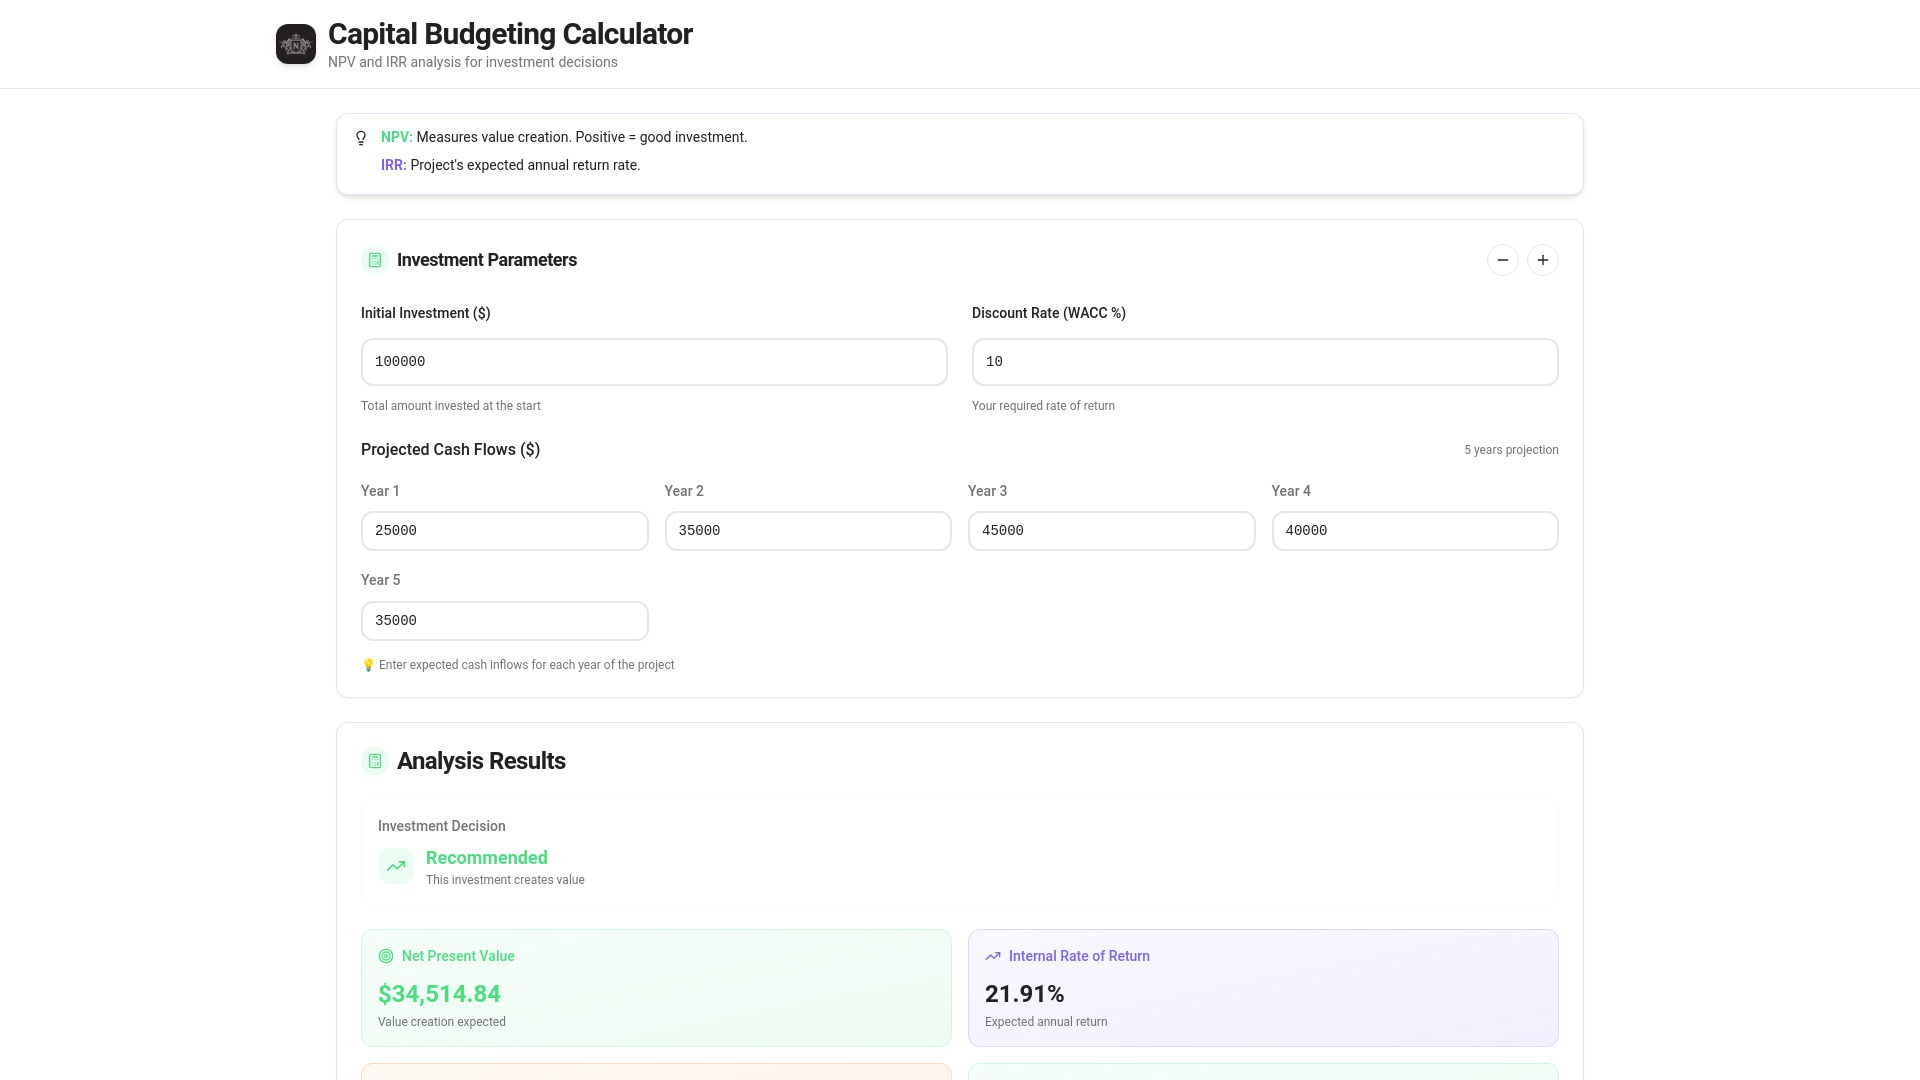
Use our online calculator to find the NPV, IRR and Payback Period of your project. Link here.
Case Study: Toscana Imports’ Strategic Pivot
Toscana Imports, a U.S. arm of an Italian olive oil producer, imports 1 million liters annually at $10/liter ($10 million), but a 15% tariff adds $1.5 million, raising costs to $11.5 million.
Revenue holds at $15 million, yet price hikes risk losing customers amid 2025’s tariff volatility.
Option: Build a $20 million California facility with $8 million annual operating costs.
Payback Period: 20M / 7M = 2.86 years—fast recovery to reinvest.
Discounted Payback: Discounted cash flows ($6.36M year 1, $5.78M year 2, etc. at 10%) recover $20M by year 3.5—sustainable under pressure.
Why Methods Drive the Decision: Payback shows quick liquidity (2.86 years) to handle tariff spikes, while Discounted Payback adjusts for 30% risk, ensuring viability. Without these, Toscana might delay, losing $3.5M annually to imports. The concept: prioritize cash recovery speed, with a clear result favoring local action.
Aha Moment:
Payback tools align cash flow with tariff threats for a timely pivot.
The Signals: When and Why to Use Payback Periods
When to Use Payback Periods:
Cash Flow Pressure: Ideal when tariffs strain liquidity, needing fast recovery—use alone for quick decisions.
Short-Term Focus: Best for projects under 5 years, like initial setups—pair with NPV/IRR for balance.
Risk Assessment: Discounted Payback suits volatile 2025 trade scenarios, enhancing IRR’s return view.
2025 Signals for Planning:
Tariff Escalation: 15-25% duties on EU goods, with a 30% surge predicted by year-end.
Reshoring Trend: Deloitte’s 2025 outlook forecasts 5 million U.S. manufacturing jobs returning, urging action.
Trade Deals: Nvidia’s $25 billion rescue and Apple’s $600 billion bet signal a domestic production race—plan now.
This is the moment to act as trade policies harden.
The Manager’s Capital Budgeting Playbook: 5 Steps
We can apply the same playbook seen in the previous newsletter (link here). Here’s a short recap:
Step 1: Map Cash Flows
Estimate initial investment (e.g., $20M for a facility) and annual costs/revenues.
Step 2: Calculate Payback and Discounted Payback (in addition to NPV and IRR)
Step 3: Conduct Scenario Analysis
Step 4: Apply Statistical Forecasting
Step 5: Decide and Adapt
If NPV > 0 and IRR > cost of capital, invest locally.
If Payback < 5 years and aligns with cash needs, invest. Adjust with scenarios and stats
Critical Insights: Lessons from the Trade Shift
Intel’s move and Nvidia’s deal underscore cash flow’s role in trade survival. Payback and Discounted Payback complement NPV/IRR, focusing on recovery speed—vital as 30% tariffs loom. Statistics refine forecasts, per our prior series, while big firms’ government ties contrast mid-sized needs.
Manager Takeaway: Use Payback tools to secure cash flow and beat tariff threats.
What’s Your Cash Plan?
Share your local production plans on X. How are you tackling 2025 tariffs? Join the discussion!
Top Links to Deep Dive
Want to go beyond today’s breakdown? Here are the best resources to master this topic:
Cornell – Financial Management. Link here.
The Kobeissi Letter – Official X Page. Post’s link here.
The Noble Manager – 2025 Trade Survival: Capital Budgeting for Local Production Now. Link here.
The Noble Manager – The #1 Sales Forecasting Mistake — and How Confidence Intervals Fix It. Link here.
The Noble Manager – Sales Forecasting Simplified: A 3-Step Framework for Better Decisions. Link here.
Final Thought
With 2025 tariffs threatening cash flow, mastering Payback Periods and Discounted Payback is your edge for local production success. Stay tuned for Part 3 on profitability!
Until next time, keep innovating—and keep it noble!
Filippo Esposito
Founder, The Noble Manager