Good Morning, Noble Managers! It’s Wednesday, August 13.
Topic: Financial Strategy | Capital Investment | Trade Adaptation
For: B2B and B2C Managers.
Subject: Capital Budgeting → Practical Application
Concept: Evaluate local production with capital budgeting
Application: Use NPV and IRR to decide between imports and local setup
Don’t keep us a secret. Share this newsletter with friends (copy URL here).
TL;DR:
Why trade deals (e.g., Nvidia’s revenue-sharing pact) force mid-sized firms to rethink imports
How capital budgeting with NPV and IRR guides local production decisions
2025 outlook: Master these tools as tariffs may hit 30%—act now to thrive
Introduction
This post on X unveils a seismic shift: Nvidia and AMD agreed to share 15% of China chip revenue with the U.S. government to lift export controls, brokered with President Trump. Similarly, Apple’s $600 billion U.S. investment counters tariff threats.
This marks a turning point—if you’re not big enough to negotiate directly with Trump, you’re left powerless, subject to tariffs.
For medium and small companies importing goods in the US—especially national sales arms of EU manufacturers or EU/Asia importers—this means potential 15-25% cost hikes could erode 5-15% of revenue (with experts predicting a possible tariff surge by year-end amid trade tensions).
The solution? Lobby for relief or pivot to local production.
How? Capital budgeting—a financial GPS to navigate this storm—offers the tools to make informed decisions.
This first of a three-part series that introduces why this matters and dives into:
NPV and IRR
Payback periods
Profitability metrics
Let’s kick this off.
Understanding Capital Budgeting: Your Strategic Edge
Capital budgeting is your financial GPS, guiding long-term investment decisions like shifting from imports to local production by mapping cash flows, risks, and returns.
It empowers managers to quantify profitability and align strategies with 2025’s trade shifts. This method employs six key techniques:
Methods 1 and 2: Net Present Value (NPV) and Internal Rate of Return (IRR):
Measure value and return via discounted cash flows—our focus here for long-term projects.
Methods 3 and 4: Payback Period and Discounted Payback Period
Track recovery time, covered next.
Methods 5 and 6: Profitability Index (PI) and Equivalent Annual Cost (EAC)
Assess efficiency and costs, explored in Part 3.
NPV and IRR 101: Understand If Your Project Is Viable
Net Present Value (NPV):
Discount future cash flows to determine if the investment exceeds the cost of capital. A positive NPV justifies the move.

How to Apply:
Estimate the initial investment (C0 ) and future cash flows (CFt) for each period.
Determine the appropriate discount rate (( r )) based on the project's risk or the company's cost of capital.
Discount each future cash flow to its present value using the formula.
Sum the present values of all cash inflows and subtract the initial investment.
If NPV > 0, accept the project; if NPV < 0, reject it.
Internal Rate of Return (IRR):
Compare the project’s return to the company’s hurdle rate. If IRR > cost of capital, it’s viable. In other words, IRR is the discount rate that makes the NPV of all cash flows from a project equal to zero.
It represents the expected annualized rate of return and is compared to the required rate of return.

How to Apply:
Estimate the initial investment and future cash flows.
Use trial and error, financial calculators, or Excel’s IRR function to find the rate that sets NPV to zero.
Compare the IRR to the cost of capital or hurdle rate.
If IRR > cost of capital, accept the project; if IRR < cost of capital, reject it
Example:

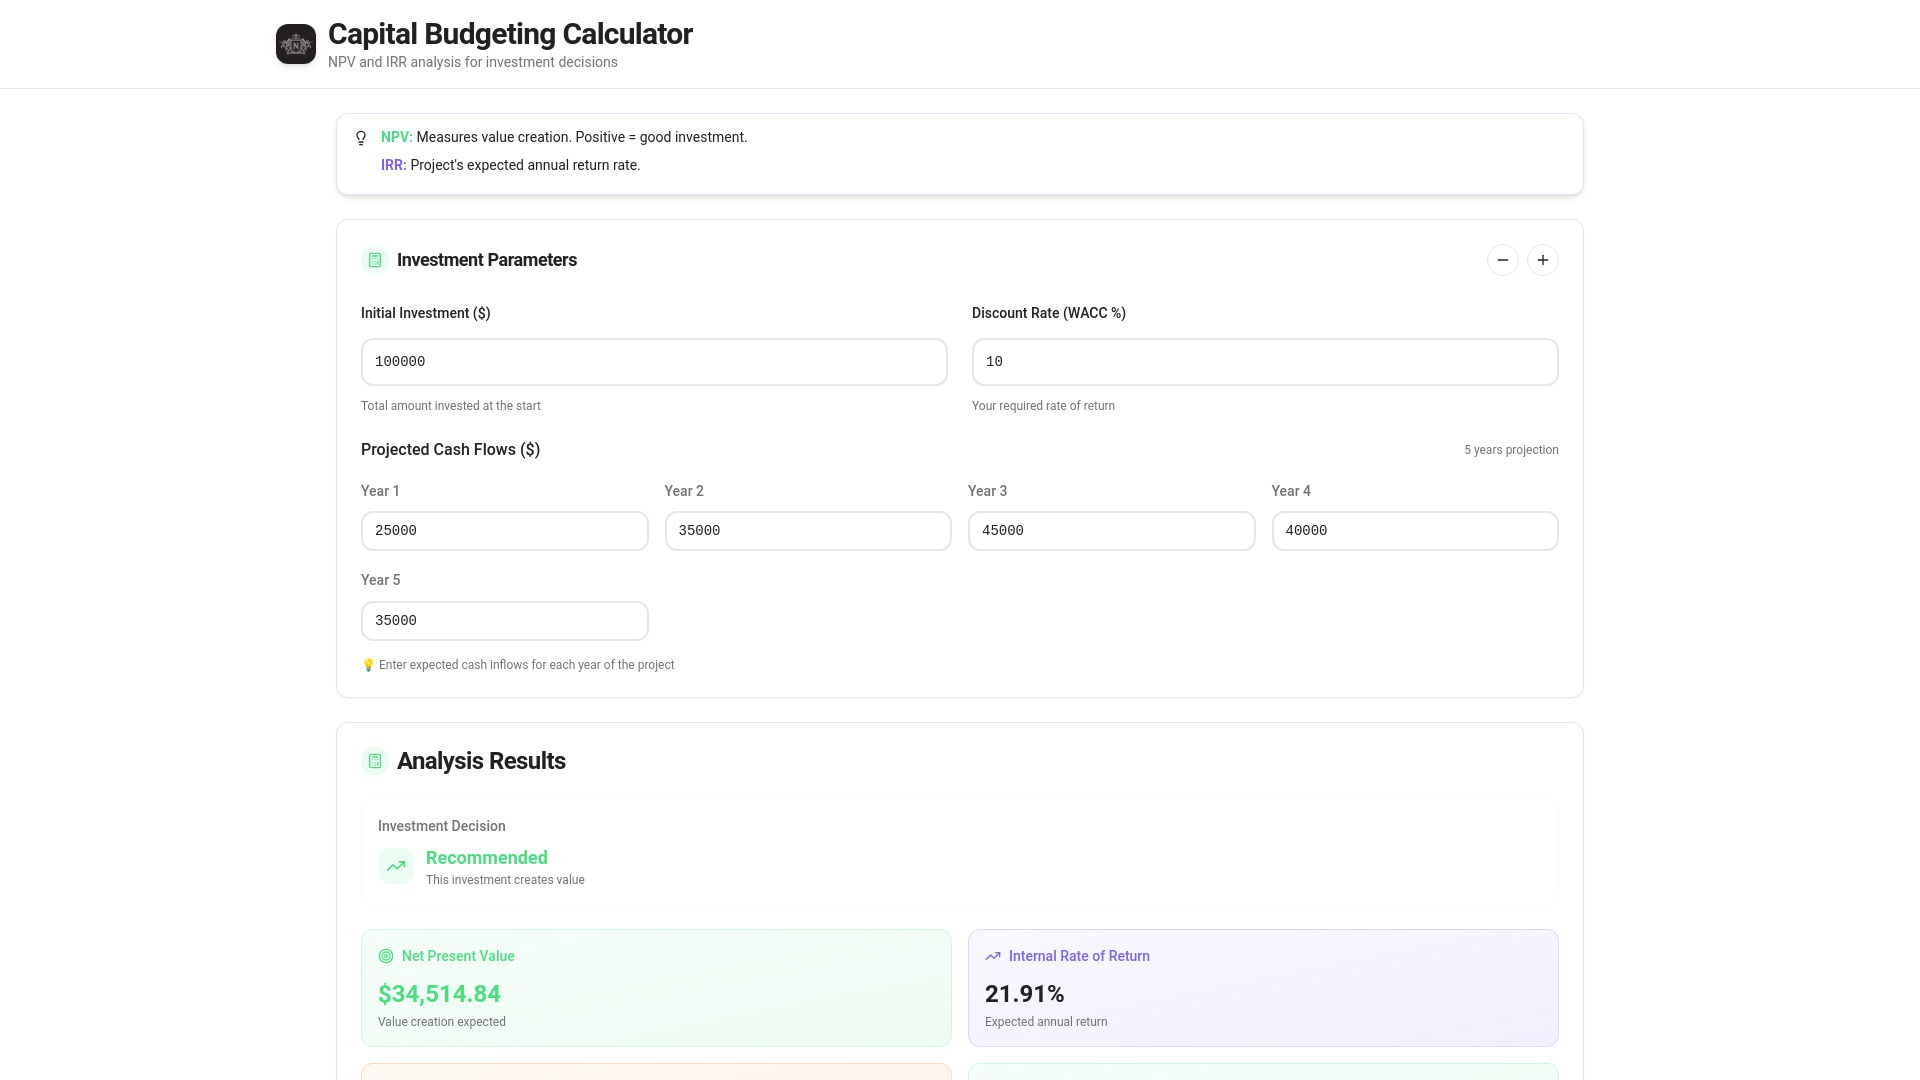
NPV Example: A $100,000 investment yielding $30,000 annually for 5 years at 10% discount rate gives $13,722—green light!
IRR Example: Same cash flows yield 12.5% IRR, beating a 10% cost of capital—go for it!
Use our online calculator to find the NPV and IRR of your project. Link here.
Case Study: Toscana Imports’ Strategic Pivot
Toscana Imports, a U.S. arm of an Italian olive oil producer, imports 1 million liters annually at $10/liter ($10 million), but a 15% tariff adds $1.5 million, raising costs to $11.5 million.
Revenue holds at $15 million, yet price hikes risk losing customers amid 2025’s tariff volatility.
Option: Build a $20 million California facility with $8 million annual operating costs.
NPV Analysis: Annual cash flow = $7 million ($15M - $8M). Over 10 years at 10% discount rate, PV = $43.9 million. NPV = -$20M + $43.9M = $23.9 million (positive).
IRR Analysis: IRR ≈ 35%, far exceeding the 10% cost of capital.
Why Methods Drive the Decision: NPV and IRR account for tariff risks (e.g., a potential 30% hike) and time value, revealing a $23.9 million value gain over imports.
Without these, Toscana might have misjudged, stuck with costlier imports amid unpredictable trade shifts. The overall concept: quantify trade-offs with data, with a clear result favoring local production. (Test the calculator for the example)
Aha Moment:
NPV and IRR turn trade uncertainty into a winning strategy.
The Signals: When and Why to Use NPV and IRR
When to Use NPV and IRR:
Long-Term Projects: Perfect for manufacturing shifts (e.g., Toscana’s plant) spanning years.
High Uncertainty: Ideal for tariff-driven decisions with variable costs or 30% tariff risks.
Strategic Shifts: Essential when comparing imports vs. local production with big upfront costs.
2025 Signals for Planning:
Tariff Escalation: 15-25% duties on EU goods, with a 30% surge predicted by year-end.
Reshoring Trend: Deloitte’s 2025 outlook forecasts 5 million U.S. manufacturing jobs returning, urging action.
Trade Deals: Nvidia’s $25 billion rescue and Apple’s $600 billion bet signal a domestic production race—plan now.
This is the moment to act as trade policies harden.
The Manager’s Capital Budgeting Playbook: 5 Steps
Use this 5-step playbook quarterly to evaluate local production and stay ahead:
Step 1: Map Cash Flows
Estimate initial investment (e.g., $20M for a facility) and annual costs/revenues.
Example: Compare $11.5M import cost with $8M local operating cost against $15M revenue.
Step 2: Calculate NPV and IRR
Use NPV to assess value: Discount $7M/year at 10% minus $20M investment = $23.9M.
Compute IRR (e.g., 35% vs. 10% capital) to confirm viability.
Tool: Excel or our calculator.
Step 3: Conduct Scenario Analysis
Model best/worst cases (e.g., 30% tariff = $28M NPV; 10% tariff = $19M NPV) to assess risk.
Step 4: Apply Statistical Forecasting
Step 5: Decide and Adapt
If NPV > 0 and IRR > cost of capital, invest locally.
Adjust with scenario and statistical insights, aligning with 2025 trends.
Critical Insights: Lessons from the Trade Shift
Nvidia’s $25 billion rescue and Apple’s $600 billion move prove capital budgeting’s power. NPV and IRR suit long-term trade adaptations, while payback (next issue) fits shorter horizons. With 2025 tariffs potentially hitting 30%, statistics enhance cash flow accuracy—our prior series offers the know-how. Larger firms’ lobbying (e.g., Nvidia’s deal) complements mid-sized reshoring, broadening the strategy.
Manager Takeaway: Leverage NPV, IRR, and stats to turn trade threats into wins.
What’s Your Trade Move?
Share your local production plans on X. How are you tackling 2025 tariffs? Join the discussion!
Top Links to Deep Dive
Want to go beyond today’s breakdown? Here are the best resources to master this topic:
Cornell – Financial Management. Link here.
The Kobeissi Letter – Official X Page. Post’s link here.
The Noble Manager – The #1 Sales Forecasting Mistake — and How Confidence Intervals Fix It. Link here.
The Noble Manager – Sales Forecasting Simplified: A 3-Step Framework for Better Decisions. Link here.
Final Thought
Trade shifts in 2025 demand bold moves—capital budgeting with NPV, IRR, and statistical rigor is your key to navigating tariffs and securing local production success. Stay tuned for Part 2 on payback periods!
Until next time, keep innovating—and keep it noble!
Filippo Esposito
Founder, The Noble Manager